Testing ERA's Randomness: What a Certificate Can't Tell You


TL;DR: Nearly every hardware wallet answers "is your randomness good?" by naming a certified chip. A certificate describes silicon in a lab, not the wallet on your desk, and the Coldcard failure happened entirely in the gap between the two. So we put our own shipping device on a bench and ran the full international test canon on it: NIST SP 800-90B, NIST SP 800-22, BSI AIS-31, PractRand, and a 1,000-restart cold-boot analysis. To check the bench itself works, we also pushed eight deliberately broken generators through the identical analysis pipeline, one of them the exact software formula that failed inside Coldcard, restart-tested in both ways it could have booted. Six got caught, the Coldcard formula among them the moment the cold-boot test sees it as published. The survivors share a single failure: a small hidden state behind flawless-looking output. The Coldcard formula in its shipped configuration is one of them. We show you why that should change how you read any vendor's randomness claim. The data, the code and the fakes are all public, so you can re-run every figure below in your browser.
In the previous article we explained how ERA builds your seed phrase from up to five independent sources of randomness. That was a description of a design. This is the measurement: the full international test canon, run on the device we actually ship.
This is a technical article, and the figures below are the actual output of our test bench rather than illustrations. Everything is explained as we go. You do not need a statistics background, just patience for a few real charts. Confidence, we hope, should come from seeing the evidence, not from being told about it.
It is also, deliberately, the easy version. Every figure and number below comes from a full 27-page technical report that carries the complete methods, statistics and limitations with nothing simplified; the report, the analysis notebook and the raw data all live in the repository. Where this article rounds a corner for readability, the report is the straight line.
The question nobody in this industry answers
Ask some hardware wallet maker whether their randomness is trustworthy, and you will get a version of the same answer: we use a certified secure element. Usually with a certificate number attached.
It sounds like an answer. It isn't quite one.
A chip certificate is essentially analogous to a driving licence issued to the factory, not an MOT for the car in your garage. It says a particular piece of silicon, tested under the manufacturer's conditions, behaved correctly on the day it was assessed. It says nothing about whether the wallet in your hand wires that chip up properly, whether the firmware actually calls it, or what comes out in the first seconds after you press the power button.
That gap is not theoretical. In July 2026, Coldcard users lost more than $114 million because a single line of build configuration meant the firmware quietly stopped asking the hardware chip for randomness and used a less secure software formula instead - a small PRNG called Yasmarang. Remember the name; it returns later, on our bench. The chip was fine. It was simply never being asked. And for five years nothing surfaced it: the flaw sat in open-source firmware in plain sight, and the output gave nobody a reason to look - output from this class of fault sails through ordinary randomness checks, as we are about to demonstrate on the very formula in question.
So the honest version of the question is not "is your chip certified?" It is "have you tested the device you actually ship, and will you show your work?" We are not aware of any consumer hardware wallet that publishes this. So we did it.
A word on NIST, since we are about to lean on it
NIST is the US National Institute of Standards and Technology, a government body that has been writing measurement standards since 1901. It is the organisation that decides what a kilogram weighs in America, and it also publishes the rulebooks the world uses for cryptography. The AES encryption protecting your bank connection is a NIST standard. So is SHA-256, the hash function underneath Bitcoin.
For randomness, NIST publishes two documents that matter here, and they do different jobs.
NIST SP 800-22 is a bag of 15 statistical tests. It takes a pile of bits and asks whether they look random. Are there roughly as many ones as zeros? Do suspicious runs repeat? Does some pattern show up more often than chance allows? This is the document vendors mean when they say "passes NIST".
NIST SP 800-90B is the harder one. It tries to measure how much genuine unpredictability a source produces, and it does so by attacking the data with ten different estimation methods - several of them literal prediction algorithms that try to guess the next byte — and reporting the score of whichever does best. It assumes your attacker is as clever as the sharpest of them.
We also use BSI AIS-31, which is the German federal equivalent, written by the Bundesamt für Sicherheit in der Informationstechnik. European smartcard and payment hardware is generally certified against AIS-31 rather than the NIST documents, so running both is how you avoid the accusation of picking the friendlier rulebook.
One thing to hold on to as you read on. All of these standards examine bits that have already come out of a generator. None of them can see inside it. That distinction turns out to be the whole story.
What we tested, and how we kept ourselves honest
We took an ERA unit and pulled raw randomness from both of its hardware sources: 125 megabytes from the STM32H753 microcontroller's built-in generator and 44 megabytes from the ATECC608C secure element. The secure element is the slower of the two by a wide margin (we measured 1,143 bytes per second, against 88,987 bytes per second draining the microcontroller over the capture link), because that is simply how fast the chip will hand bytes over. Collecting its share took eleven hours. Every byte came out through exactly the same firmware calls the product uses when it makes your seed. (The commands that export those bytes over the debug cable exist only in an instrumented test build made for this evaluation; release firmware has no interface for reading randomness out of the device.) Then we power-cycled the device 1,006 times with an automated relay; six cycles failed our boot verification and were discarded, leaving exactly 1,000 verified boots, with the first bytes captured after each.
Is that enough data? Each of these standards states its own minimum, so the question has an answer rather than an opinion. Here is what each one asks for and what we gave it.
| Test | What the standard requires | What we fed it | Conforms? |
|---|---|---|---|
| NIST SP 800-90B, sequential | at least 1,000,000 consecutive samples (§3.1.1) | 1,000,000 bytes per assessment, repeated on 12 non-overlapping slices | ✅ met – 12 disjoint assessments, each conforming on its own |
| NIST SP 800-90B, restart | 1,000 restarts × 1,000 samples from each (§3.1.4) | 1,000 verified cold boots × 1,024 bytes (1,006 cycles run; 6 discarded) | ✅ met – the 1,000 × 1,000 matrix, using the first 1,000 of each boot's 1,024 bytes |
| NIST SP 800-22 | 1,000,000 bits per sequence; at least 55 sequences before the second-level criterion is valid (Rev 1a §4.2.2) | 100 sequences × 1,000,000 bits = 12.5 MB per generator | ✅ both criteria apply at 100 |
| BSI AIS-31, Procedure A | 216 consecutive 48-bit words for T0, then 257 samples of 20,000 bits for T1–T5 | 1,038,216 bytes, the exact budget including the spare block the retry rule needs | ✅ met to the byte |
| PractRand | no minimum; the tool simply gets stricter the more you give it | a ladder doubling from 1 KB to 64 MB (STM32) and 32 MB (secure element) | no bar to clear, and we say where ours stops |
Only the last row has no fixed requirement, and that is the honest reason the secure element's ladder stops one rung short of the microcontroller's. It is not a weaker result, just less data: the chip hands bytes over seventy-eight times more slowly (the two measured rates above), and we stopped collecting after eleven hours.
Before trusting a single passing result, we did one more thing: we assembled eight deliberately broken generators and pushed them through the identical analysis pipeline. Seven are failure models we wrote. The eighth is not a model at all - it is Yasmarang itself, the exact formula that replaced the TRNG inside Coldcard, byte-for-byte as it ships in MicroPython, the language runtime Coldcard firmware is written in.
| Our fake | What it models | Real-world precedent |
|---|---|---|
| Stuck-at | a dead chip, same byte forever | any failed TRNG |
| Biased | a weighted coin: 60% ones instead of 50% | classic unwhitened hardware fault |
| Masked error-runs | a driver quietly writing error constants (0xFF…) into otherwise good data |
documented RNG-driver failure mode |
| Weak old formula | a 1970s linear congruential generator (LCG) | textbook bad RNG |
| 32-bit PRNG | flawless-looking output, but only ~4 billion possible streams | Coldcard, Milk Sad, Trust Wallet |
| Yasmarang | not a model – the actual Coldcard fallback, run as published: exactly one possible output stream | Coldcard, July 2026 – the real thing |
| Boot-correlated | works fine, but nearly repeats itself on every power-up | YubiKey FIPS, "Mining your Ps and Qs" |
| 32-bit boot state | every power-up draws a fresh state from only ~4 billion possibilities – the 32-bit PRNG's failure, expressed per boot | Coldcard newer models, per Block's analysis |
The six stream fakes enter at Step 1 and continue until a test catches them decisively - the weak old formula is the exception, kept solely to calibrate Step 4's ladder. The two boot fakes exist as 1,000-boot restart grids and face Step 5 - and so does Yasmarang, twice, restarted in both candidate seedings: exactly as published, and reseeded from 32 bits on every boot. The 32-bit PRNG and the 32-bit boot state are the same pathology probed from both sides: as a long stream, and one power-up at a time. The scoreboard at the end records exactly which generator faced which test.
Why go to this trouble? Because a test bench that never catches anything is indistinguishable from a working device. If the fakes get caught, the tests work. Only then do our passes mean anything at all. And by including the genuine article, the bench is tested against history rather than against our own imagination.
Step 1: just look at the bytes
The simplest possible check: count how often each of the 256 possible byte values appears. In truly random data, every value should turn up about equally often. We used 200 kB from each generator here. No standard governs this one, because it is a look rather than a test, and 200 kB is simply enough for the eye to judge a 256-bar chart.
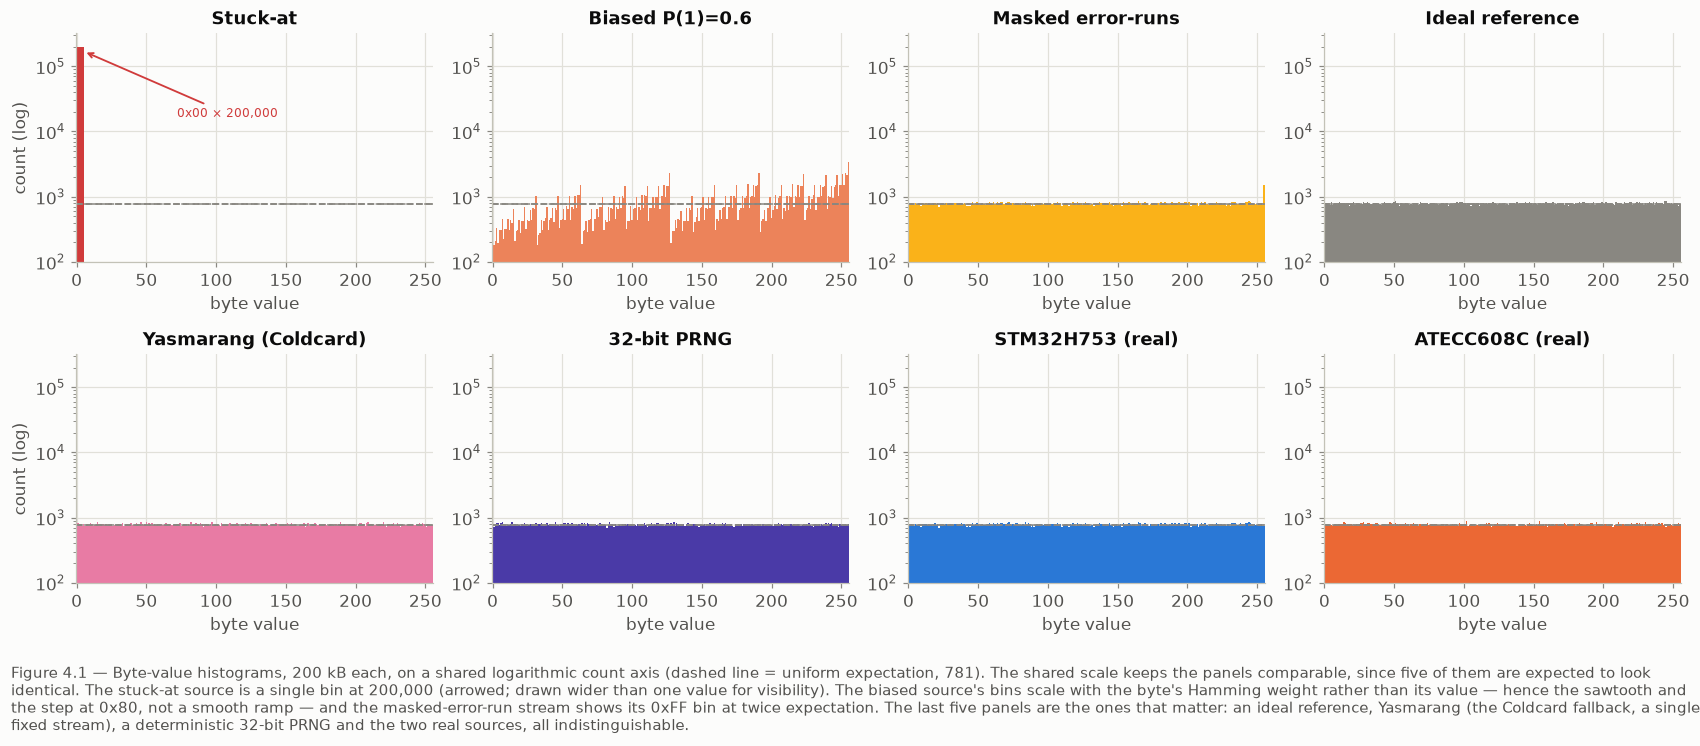
How to read it: eight panels, one generator each, drawn on the same logarithmic scale. The dashed line is where every bar should sit if the data is uniform. The stuck-at fake is one lonely spike. Total failure, obvious at a glance. The biased fake climbs across the chart, also obvious. Now compare the last five panels: a mathematically ideal reference, Yasmarang - the very formula from the Coldcard incident - our fake 32-bit PRNG, and both real ERA sources. Identical. That is the first lesson of the exercise. Looking at the output catches only the crudest failures.
Step 2: measure how unpredictable each byte is
This is NIST SP 800-90B, the harder of the two NIST documents. The quantity it reports is called min-entropy: on a scale of 0 to 8, how many bits of genuine surprise each byte carries. The score comes from whichever of its ten estimation methods - several of them literal next-byte predictors - does best against the data, which makes it deliberately paranoid. It assumes your attacker is as clever as the sharpest method in the set.
The "standard sample" the document asks for is one million consecutive samples, which for byte-wide data means exactly one megabyte. Our STM32H753 scored 6.92 bits per byte on it, and the ATECC608C 7.03.
A single number without context is how people get fooled, though, so we did something the standard does not ask for. We ran the same measurement on 12 separate one-megabyte slices of every stream, each slice a fully conforming assessment in its own right.
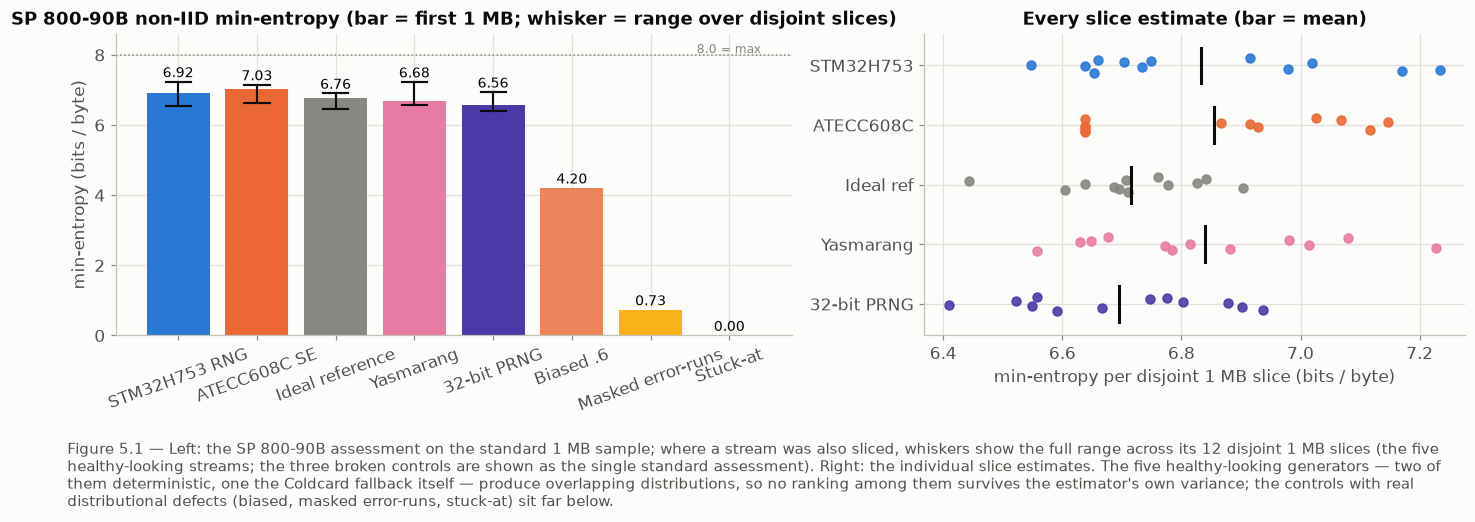
How to read it: the left panel is the official single-sample score per generator, with whiskers showing the full range across the 12 slices. The right panel shows every individual measurement. Four things to notice:
- The STM32H753 measures 6.83 ± 0.22 across slices, the ATECC608C 6.85 ± 0.21. The measurement itself is noisy. The tool's own variation is roughly ±0.2, which is wider than the gap between the two chips, so neither is "better" than the other on this evidence.
- The ideal reference measures 6.72 ± 0.12. Even perfect data does not score 8.0, because the estimator is deliberately pessimistic.
- The fake 32-bit PRNG measures 6.69 ± 0.17, sitting inside the same range as both real chips. The clouds of dots overlap completely.
- Yasmarang measures 6.84 ± 0.20. Its true unpredictability is exactly zero - the formula has one possible output stream, fixed before the universe began caring — and its slice range (6.56–7.23) sits inside the STM32's own (6.55–7.23).
That fourth point is the finding. This standard, correctly applied, cannot distinguish our real hardware from a generator with 4 billion possible outputs - or from one with exactly one. We did not run it badly either. The problem is that entropy is a property of the process that made the bytes, and no amount of staring at the bytes tells you anything about that process. The properly broken fakes do get caught, decisively: the biased generator scores 4.20, the error-run generator 0.73, the dead chip 0.00.
Step 3: the batteries the industry actually cites
NIST SP 800-22 is the suite regulators and vendors name when they say "passes NIST". We ran the official software: 100 sequences of a million bits each, 15 tests, 188 individual result rows per generator. Both real sources got identical treatment, and so did the ideal reference, the fake 32-bit PRNG, and Yasmarang - which is what makes the five columns comparable.
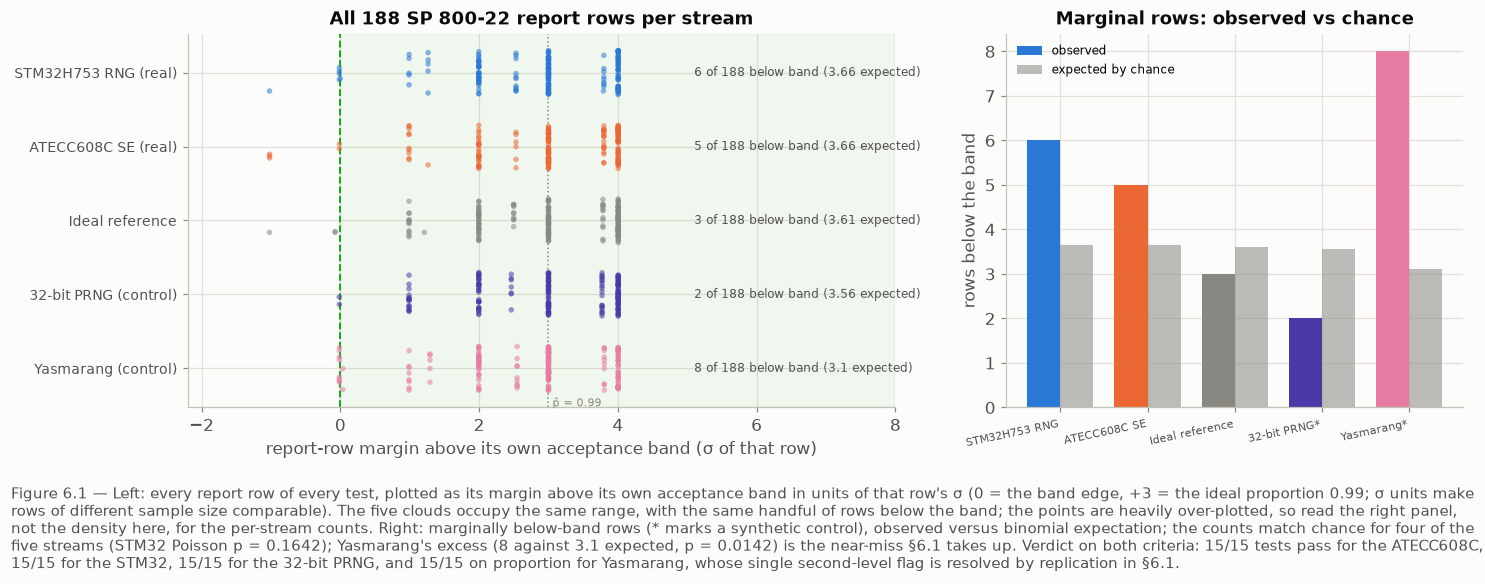
How to read it: every dot is one of the 188 test rows, plotted by how far it sits above its own pass threshold (the dashed line at zero; the dotted line at +3 is where an ideal generator centres). A few dots below zero is not a failure. With 188 rows, statistics guarantees a handful of near-misses even for flawless data. The ideal reference (grey) drops 3 rows below the line against the 3.6 that chance predicts. The STM32 drops 6 and the ATECC608C 5, against 3.7. The 32-bit fake drops 2. Yasmarang drops 8 against about 3 - the one excess in the table, and the subject of the asterisk below. (The chance expectation differs slightly per generator because a few tests apply only to sequences that wander far enough - the random-excursion rows - and how many sequences qualify varies from stream to stream.)
The verdict: our STM32H753 passes 15/15 tests. So does the ATECC608C. So does the ideal reference. So does the fake 32-bit PRNG. And so, on the headline criterion, does the actual Coldcard formula. Same cloud, same verdict. When a wallet vendor tells you their randomness "passes NIST", this chart is what that claim can and cannot rule out.
One honest asterisk. Yasmarang did trip something: one of its 188 rows failed the suite's second-level check (the one that asks whether the p-values themselves are distributed the way honest randomness distributes them). Either that is a real flaw in the formula or a statistical false alarm, and there is a standard way to find out: run the entire suite again on a different 12.5 MB stretch of the same stream. A real flaw lives in the generator and shows up in every window; a false alarm lives in one sample. The re-run came back spotless — 15/15 on both criteria, 2 marginal rows where chance predicts 3.5. A flag of this size is expected to appear by chance in roughly one five-generator table out of ten, and both runs ship in the repository (technical report, §6.1). But notice what it took to even see the wobble: 100 sequences and a second-level criterion that a vendor running one sequence - which is the common practice - never computes.
We also ran BSI AIS-31 in full, the German federal standard: six test procedures, 1,286 individual checks. (Unlike NIST, the BSI publishes no official test program - the standard is a precise specification, and our ~150-line implementation of Procedure A ships in the repository, short enough to read over coffee.) Same outcome. Both real sources pass with zero failures, as does the ideal reference. The biased fake fails 777 of the checks. The 32-bit fake passes clean. So does Yasmarang.
Step 4: set a bloodhound on it
PractRand is the most sensitive pattern-hunter in common use. Unlike the standards above it sets no minimum, because it has no pass mark to define: it just keeps looking, and the more data you give it the smaller the flaw it can find. So the meaningful question is not whether we fed it enough, but how deep we got before running out of data. We ran it as an escalating ladder: examine 1 KB, then 2 KB, then 4 KB, doubling all the way to 64 MB, with a fresh verdict at every depth.
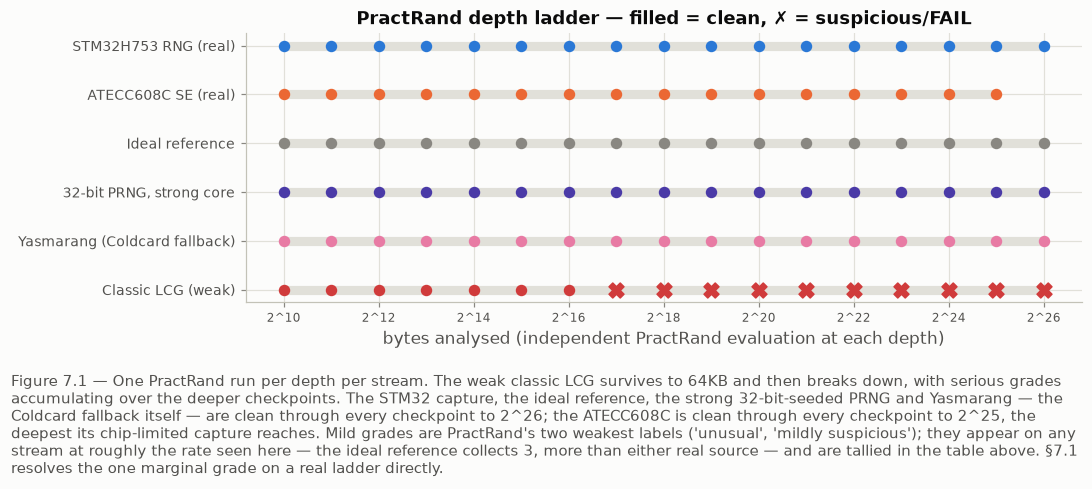
How to read it: each row is a generator, each dot one examination depth. A red ✗ means structure was found. The weak 1970s formula survives to 64 KB and then collapses, every deeper look finding more wreckage, 285 alarms by the end. That is what it looks like when this tool catches something. Now look at the five rows above it. The real STM32H753 is clean through every depth to 64 MB, the ATECC608C through every depth its capture reaches at 32 MB, the mathematically ideal reference likewise, and so is the fake 32-bit PRNG. So is Yasmarang, and that row deserves a moment. The bloodhound reads 64 megabytes produced by the exact formula that emptied those wallets, and reports nothing wrong. Sensitivity to patterns is not sensitivity to how few possibilities exist.
Four tests in, the scoreboard is uncomfortable. Everything the industry routinely cites, plus one tool sharper than anything it cites, passes a generator we built to be enumerable - and passes the genuine article that failed in the field. This is how the Coldcard flaw survived five years of scrutiny. If output-only testing is all a vendor does, this blind spot is what their assurance is worth.
Step 5: the test that actually catches it
Your seed is not made from a long comfortable stream on a warm, long-running device. It is made once, on a freshly powered-on wallet - for most people, somewhere in the first ten or twenty minutes after the device comes out of the box and is switched on for the first time. So the property that matters is whether every power-up produces fresh, unrelated randomness, or whether the device wakes up in a state you could have predicted.
SP 800-90B specifies this experiment down to the numbers: restart the source 1,000 times and take 1,000 samples after each restart, then analyse the resulting grid both along its rows and down its columns. So that is what the relay rig is for. Power off, verify the device really died, power on, verify it really rebooted, capture the first 1,024 bytes from each source. One thousand verified times - 1,006 cycles over 4.7 hours, with the six that failed verification discarded rather than trusted, which is how the count lands on exactly the 1,000 × 1,000 grid the standard prescribes.
If any two boots start from the same internal state, their first bytes come out identical. So we compared every boot against every other boot: 499,500 pairs, checked for repeats, for shared openings, and for position-by-position bias.
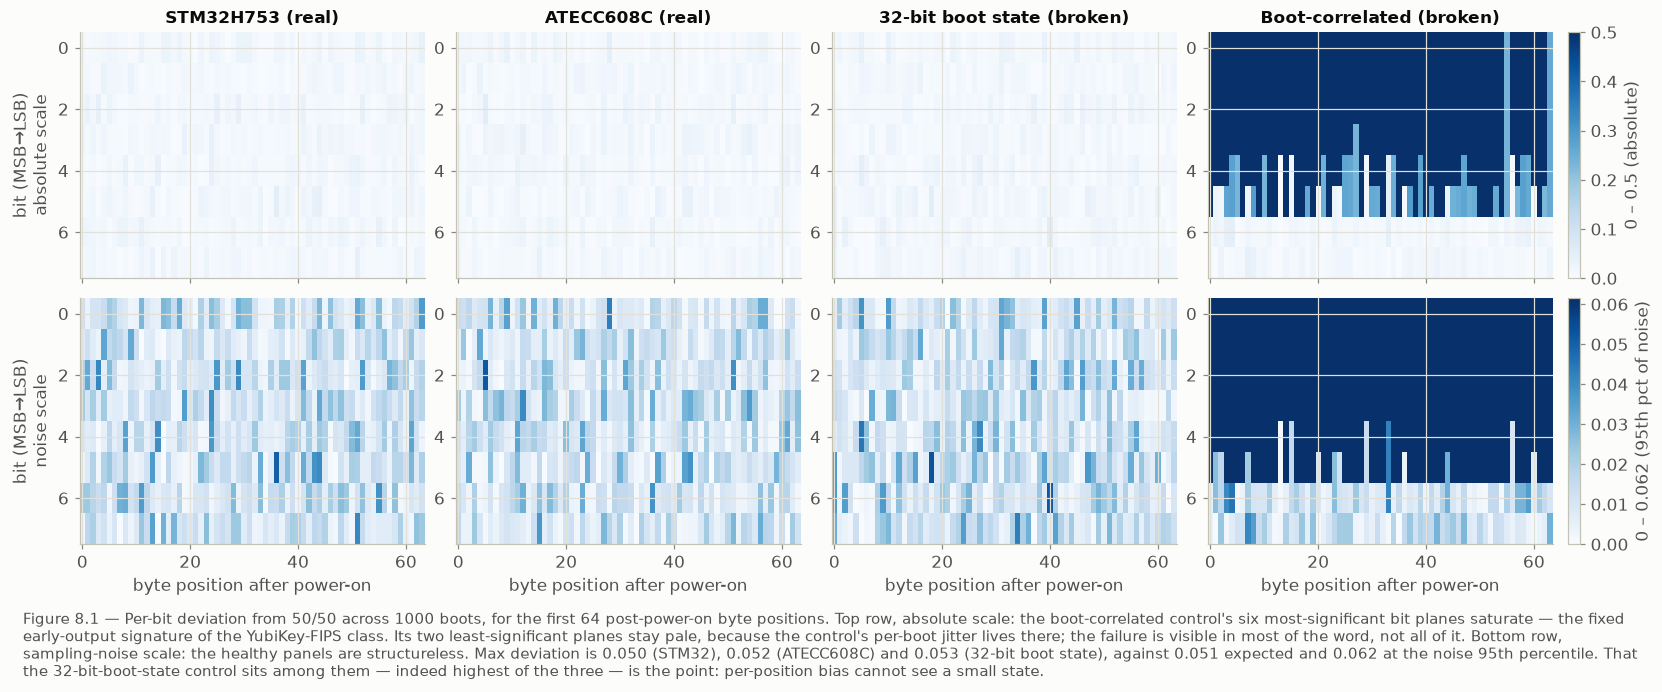
How to read it: four generators, one per column - the two real sources, then two controls: the 32-bit boot state fake (perfect-looking output, small hidden state) and the boot-correlated fake. Each panel maps the first 64 bytes after power-on (left to right) and each bit within them (top to bottom); darker blue = that bit leans away from 50/50 across the 1,000 boots. The top row uses an absolute scale; the bottom row zooms to the level of pure sampling noise. The boot-correlated fake (rightmost) lights up across most of the map, because its early output nearly repeats on every boot and the test sees that instantly; its two pale rows are where the small per-boot variation we gave it actually lives. Both real ERA sources are indistinguishable from noise - maximum deviation 0.050 (STM32H753) and 0.052 (ATECC608C) against 0.051 expected from chance alone at 1,000 samples. And the third panel is the sobering one: the 32-bit boot-state fake reads 0.053, sitting right among the healthy panels. Position-by-position bias catches structured wake-ups; it cannot see a small state.
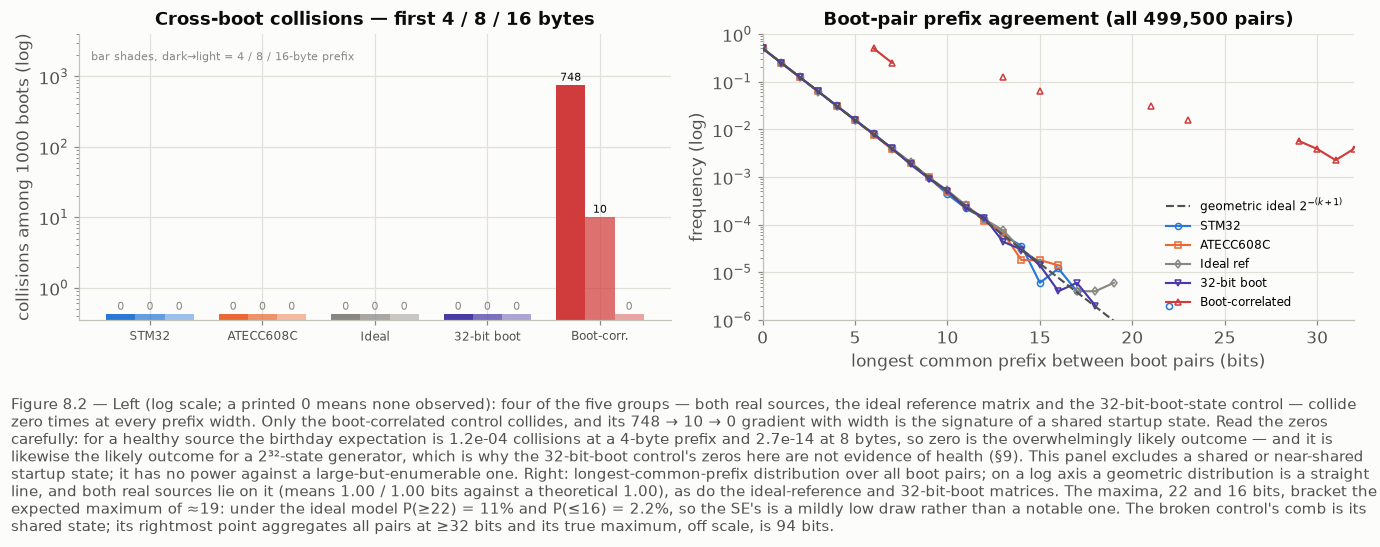
How to read it: the left panel counts outright repeats, meaning two boots that start with the same 4, 8 or 16 bytes. Both real sources: zero, at every width. So are the ideal reference and, tellingly, our 32-bit fake. Only the boot-correlated fake collides, 748 times. The right panel asks a subtler question. Across all 499,500 pairs, how long is the longest opening run that two boots share, measured in bits? For honest randomness this follows a precise mathematical curve (the dashed line: half the pairs share nothing, a quarter share one bit, and so on). Both real sources sit exactly on the theory line: the average shared opening is 1.00 bits for each of them, where the theory says 1.00. The ideal reference and the 32-bit fake land on it too, and that second one is the limit that "What we are not claiming" spells out below. Only the boot-correlated fake breaks away, and its comb-shaped spikes are its shared startup state showing through.
One more result hides in these numbers, and it is the practically important one: the ATECC608C's datasheet promises it re-seeds itself from physical noise on every wake. Promises are what the certificate covers. Here we verified the observable consequence on our board: 1,000 wake-ups with no detectable correlation between any two of them, within the detection limits spelled out under "What we are not claiming". That is still the difference between citing a certificate and testing a device.
And since the formula from the incident was already on the bench, we gave it the same treatment, fairly, in both ways it could plausibly boot. As published, with its fixed built-in constants, every start replays the identical stream, and the analysis convicts it on contact: 999 of 999 possible first-draw collisions, every pair of boots sharing its entire opening, positional deviation pegged at the theoretical maximum of 0.5, and the standard's sanity check failing at X_max = 1,000 against a cutoff of 30. Caught, in effect, at the second boot. Reseeded with a fresh 32-bit value on every boot (Block's reading of what actually shipped), the very same formula walks through untouched: zero collisions, shared openings exactly on the theory line, restart validation passed.
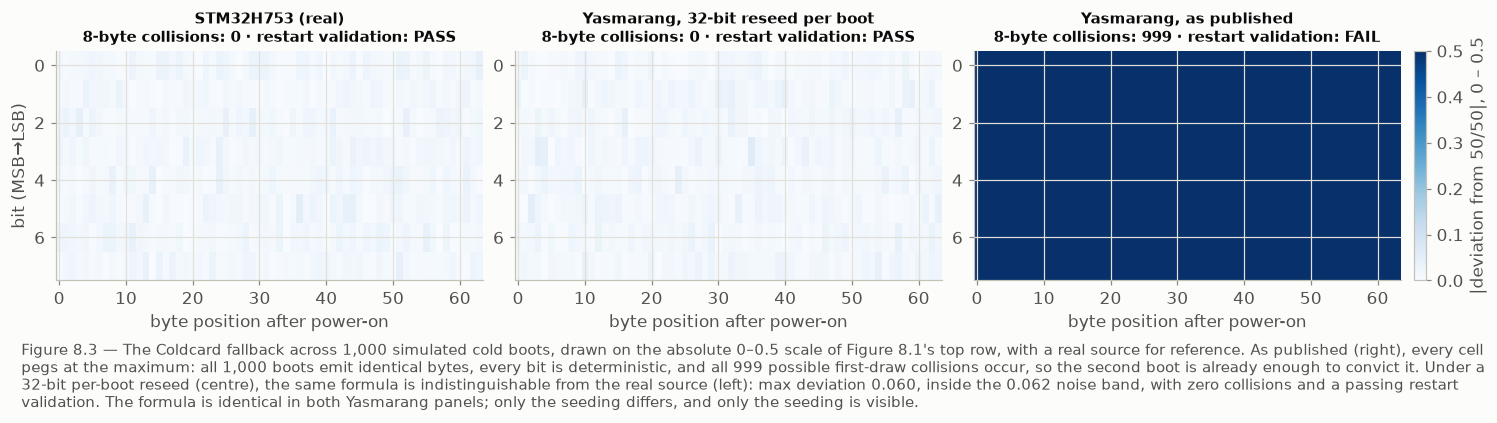
How to read it: the same map style as before, three panels on one absolute scale. On the right, the formula as published: the entire map is pinned at the maximum, because all 1,000 boots produced identical bytes. There is nothing subtle to find here; the second boot already convicts it. In the centre, the same formula reseeded with 32 bits per boot, and it is indistinguishable from the real hardware on the left. One formula, two seedings, one test. The cold-boot analysis catches the naive mistake on contact, and the shipped mistake sits in a blind spot; "What we are not claiming", below, puts numbers on exactly how blind.
The full scoreboard
Every generator, every test. This is the master table from the technical report, and it is worth a minute of your time, because its shape is the argument. (Reading note: the min-entropy column shows the official single-sample assessment with the range across the 12 slices in brackets, which is why it differs slightly from Step 2's slice averages - same runs, two summaries.)
| generator | Shannon/B | 90B seq | slice range | SP 800-22 | AIS-31 A | PractRand | 90B restart |
|---|---|---|---|---|---|---|---|
| STM32H753 RNG (real) | 8.00 | 6.92 | 6.55–7.23 | 15/15 | PASS | clean → 64MB | PASS |
| ATECC608C SE (real) | 8.00 | 7.03 | 6.64–7.15 | 15/15 | PASS | clean → 32MB | PASS |
| Ideal reference | 8.00 | 6.76 | 6.44–6.90 | 15/15 | PASS | clean → 64MB | PASS |
| Yasmarang (Coldcard fallback) | 8.00 | 6.68 | 6.56–7.23 | 15/15 (unif 14/15, §6.1) | PASS | clean → 64MB | — |
| Yasmarang boots, as published | — | — | — | — | — | — | FAIL |
| Yasmarang boots, 32-bit reseed | — | — | — | — | — | — | PASS |
| 32-bit PRNG | 8.00 | 6.56 | 6.41–6.94 | 15/15 | PASS | clean → 64MB | — |
| 32-bit boot state | — | — | — | — | — | — | PASS |
| Classic LCG (weak) | — | — | — | — | — | FAIL @ 256KB | — |
| Boot-correlated | — | — | — | — | — | — | FAIL |
| Biased .6 | 7.767 | 4.20 | — | — | FAIL | — | — |
| Masked error-runs | 7.998 | 0.73 | — | — | — | — | — |
| Stuck-at | 0.00 | 0.00 | — | — | — | — | — |
*One row of 188 tripped the second-level check on the first window; a full re-run on a fresh window of the same stream was clean on both criteria. Both runs are published (report §6.1).
A dash means that test was not run on that generator: fakes that had already failed a cheaper test decisively were not fed to the expensive ones, the weak old formula exists to calibrate PractRand and faced only it, and the boot fakes exist only as restart data. On which point - no, our software fakes did not ride the physical relay. For each boot fake we synthesised the same grid the rig produced for the real device (1,000 boots × 1,024 bytes) and ran the identical analysis on it; the relay is for the hardware, the mathematics is what everything shares.
Read it left to right. The tests get progressively sharper, and each fake falls at the column built to catch it: six fall, the Coldcard formula in its published seeding among them. The exceptions are a single family, the small-hidden-state rows: the 32-bit PRNG's output columns are all green, Yasmarang's are all green, and the two per-boot small-state rows (the 32-bit boot state, and Yasmarang under a 32-bit reseed) survive the cold-boot column at this scale. Our own harness, which catches six other failure configurations, cannot catch this class on a single device. Restart behaviour is a seeding decision rather than a property of the formula, which is why we ran Yasmarang both ways; that is the ❌ and the ⚠️ in its two boot rows, and Step 5 shows the picture. Which brings us to the section marketing departments usually delete.
What we are not claiming
The cold-boot comparison works like shared birthdays in a room. Among 23 people a shared birthday is likely, and you would spot it. But if "birthdays" could fall on any of four billion possible days, a room of 1,000 people would almost never show a repeat. That would not tell you everyone in the room had a unique birthday. It would only tell you the room was too small to find out.
Concretely, with 1,000 boots (499,500 pairs), here is the chance we'd have caught a wallet whose startup had only N possible states:
| Possible startup states | Would 1,000 boots have caught it? |
|---|---|
| 65,536 (216) | ✅ 99.95%, near certain |
| 131,072 (217) | ✅ 97.8% |
| ~1 million (220) | ⚠️ 38%, a coin flip at best |
| ~4 billion (232) | ❌ 0.01%, effectively blind |
So this campaign rules out the catastrophic small-state failures with high confidence, and the position-by-position analysis rules out wake-up weakness that shows as positional bias - bias tied to where a byte sits after power-on - at any state size. (A correlation that is not position-aligned is outside that particular instrument; the pair comparisons cover it only to the same birthday limits.) It does not rule out a well-mixed 4-billion-state fault. Our own fakes prove that: Yasmarang under a 32-bit per-boot reseed passes this very analysis. Pushing the method that far would take about 160,000 power cycles, which is 32 days of continuous switching. It is queued, not done.
And there is one limit no amount of cycling fixes. Everything here compares one device with itself. Imagine every unit were individually perfect, but the units were related to each other, with seeds derived from something like a serial number. No single-device test on Earth could see that. Detecting it requires several devices compared against each other, which is exactly what Part 2 is for.
We would rather tell you precisely where our evidence stops than let you assume it reaches further.
Check it yourself
Everything in this article is public: the raw device output, the restart captures, the analysis code, the eight fakes - the Coldcard formula included - and the full technical report behind every number above.
📁 github.com/ERAWLT/ERA-Entropy-Assessment
One click opens the notebook in your browser (Google Colab, free, no installation) and re-renders every figure in about a minute, from the shipped datasets plus the recorded results of the heavy runs. If you want to go all the way down, the repository builds the official NIST tools (the SP 800-90B assessment suite, STS 2.1.2) and PractRand from source, includes our readable AIS-31 implementation, and re-computes the entire pipeline from the raw bytes, fakes included, so you can confirm our tests catch what we say they catch.
If you find something wrong, tell us. We would rather hear it from you than not know.


Why this matters more than a certificate
Both of our chips carry real certifications, and those are worth having. But a certificate describes a component under laboratory conditions, and your funds depend on the finished device in your hand. The Coldcard seeds were generated by wallets with excellent certified hardware inside; the flaw lived entirely in the space between the certificate and the product, and citing the certificate louder would never have found it. Nobody tested the shipped device. For five years. We put the very formula that slipped through onto our own bench, and the full canon waved it past - which is the strongest argument we can offer for why the restart rig and the coming cross-device campaign exist at all.
So that is what we did to our own product. We ran the full canon, checked it adversarially against fakes we wrote to break it - and against the one history wrote - and published the parts that flatter nobody. Ask every wallet you own for the same.
Dan Mutsvanga, CTO, ERA Wallet

Get an ERA Wallet - the same device we just tested against NIST, BSI and PractRand. Code ERABLOG20 for 20% off.